|
What is Marx Graph?
Marx Graph is a collection of widgets for 2D and 3D visualizations of
the audio signal analysis produced by Marsyas, a toolkit
designed for relevant musical feature detection using a combination
of digital signal processing and machine learning techniques. The
Marx (Marsyas-Extended) widgets are written in C++ using libraries
from Qt 4, OpenGl and Marsyas. They are bundled with Marsyas and,
along with several short demo programs, can be downloaded along with Marsyas. For more
information, please visit the Marsyas homepage. Amplitude by grey scale A 2D graph in 3D space::View #1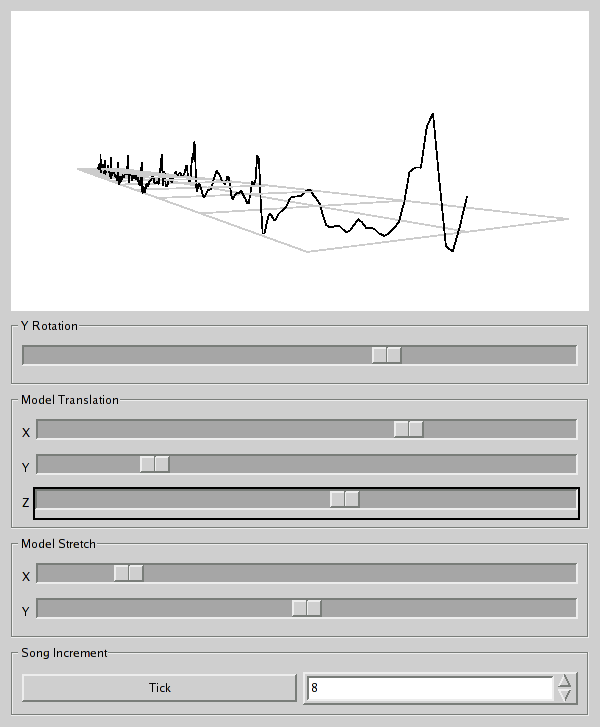 A 2D graph in 3D space::View #2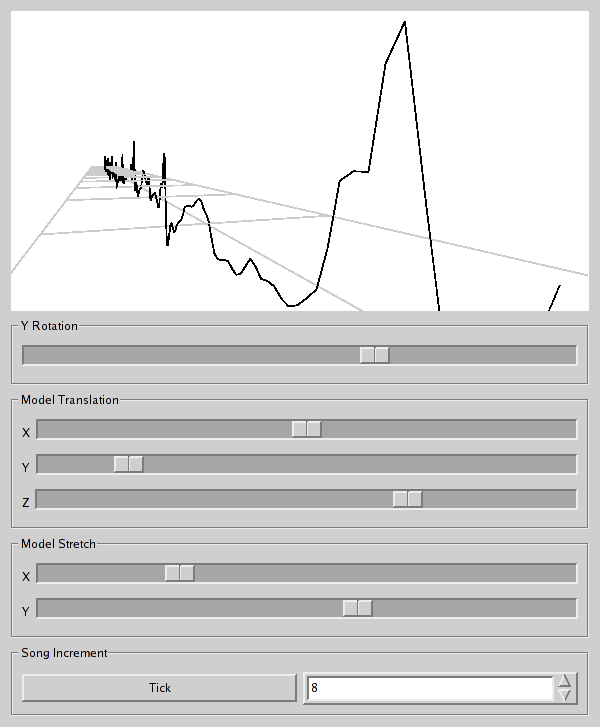 Spectrum slices with time receding on the z-axis::View #1 (Marx 3D Sliders control transformations)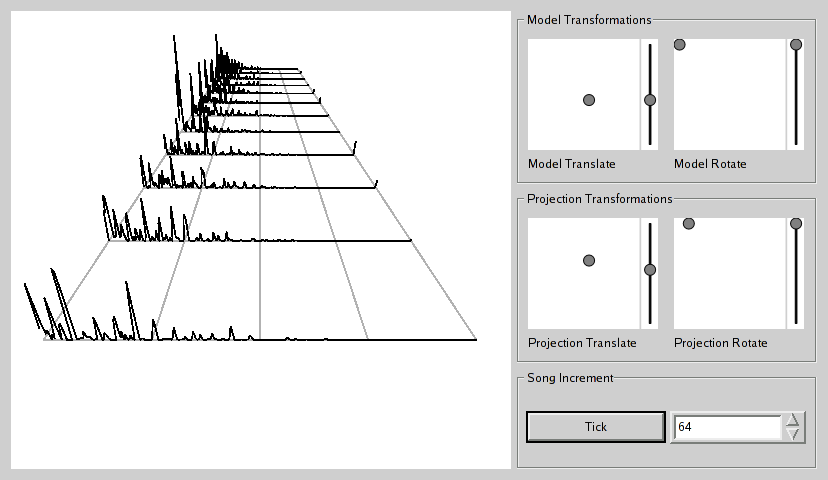 Spectrum slices with time receding on the z-axis::View #2 (Marx 3D Sliders control transformations)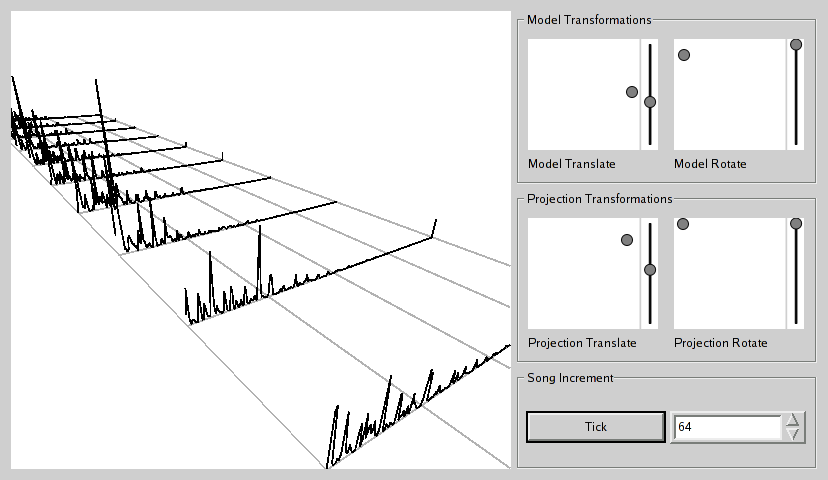 A 2D graph using polynomial interpolation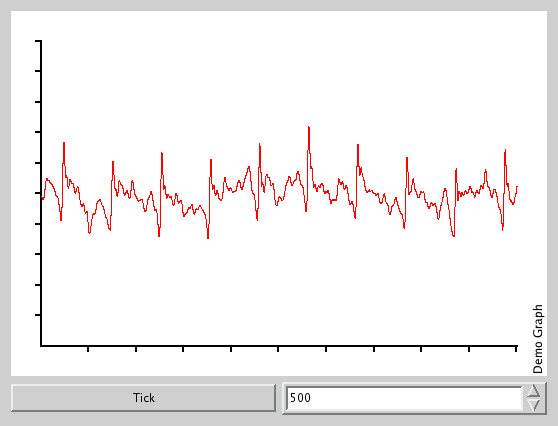 |